Chapter 2. Plotting 2-D Graphs with Graphf
The canonical 2-D plot is a scatterplot where position along the x axis denotes one quantity and the y axis another, and you have a set of (x,y) points.
unsigned i;
Graphf2DPoint points[1000];
for (i = 0; i < 1000; i++)
{
points[i].x = (double)rand () / RAND_MAX;
points[i].y = (double)rand () / RAND_MAX;
}
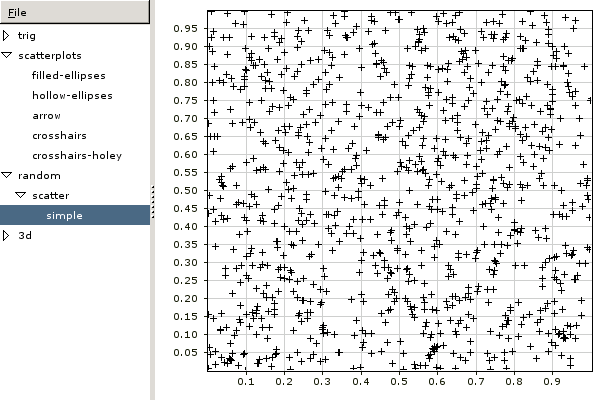
graphf_2d_plot_1 ("random/scatter/simple", 1000, points,
GRAPHF_OPTION_2D_DATASET_CONNECT, 0,
GRAPHF_OPTION_2D_DATASET_MARKER, GRAPHF_2D_MARKER_CROSSHAIR,
0);
will produce a graph like