- Table of Contents
- 1. What is graphf?
- 2. Plotting 2-D Graphs with Graphf
Chapter 1. What is graphf?
This is a tool for adding graphs to your programs.
Most programs should use graphf through its "simple" interface in graphf.h. More advanced GTK+ user-interfaces may choose to embed the Graphf widgets directly.
The simplified interfaces runs the GUI from a separate process: data is piped in from the functions. This has several advantages:
Stability. The graphf backend will stay alive after your program terminates or crashes.
Modularity.
Responsiveness.
On the other hand, if you are already writing a GTK+ 2.0 application, you may find it convenient to embed Graphf widgets inside your application. This is done using the graphf-gtk library.
Chapter 2. Plotting 2-D Graphs with Graphf
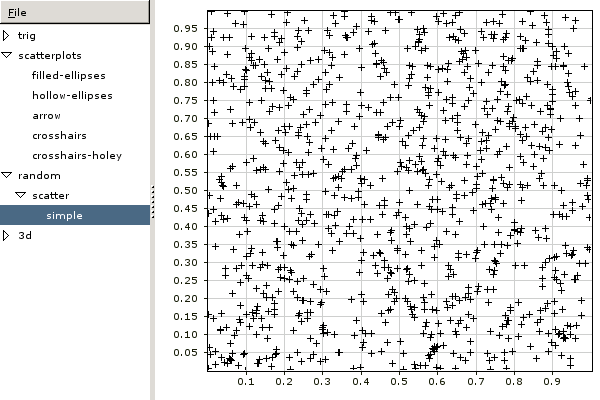
The canonical 2-D plot is a scatterplot where position along the x axis denotes one quantity and the y axis another, and you have a set of (x,y) points.
    unsigned i;
    Graphf2DPoint points[1000];
    for (i = 0; i < 1000; i++)
      {
	points[i].x = (double)rand () / RAND_MAX;
	points[i].y = (double)rand () / RAND_MAX;
      }
    graphf_2d_plot_1 ("random/scatter/simple", 1000, points,
		    GRAPHF_OPTION_2D_DATASET_CONNECT, 0,
		    GRAPHF_OPTION_2D_DATASET_MARKER, GRAPHF_2D_MARKER_CROSSHAIR,
		    0);
will produce a graph like